

Why we anchor career data to the Bureau of Labor Statistics
Choosing a field of study is, in large part, a bet on what that field will look like in five or ten years, and reliable labor-market data is the closest thing available to informed odds for that bet. Career and salary claims are one of the easiest things for an education website to get wrong, either by accident or by design, because inflated numbers make a program look like a better investment than it is. Every wage and job-growth figure referenced on this site's program pages is grounded in the U.S. Bureau of Labor Statistics (BLS) Occupational Outlook Handbook (OOH) — the federal government's own labor-market data, built from actual employer surveys rather than self-reported outcomes from schools with an incentive to look good. BLS updates its median wage data annually (most recently May 2024 figures at the time this page was written) and its employment projections roughly every two years, so figures shift over time; where we cite a specific number, we also point you to bls.gov to confirm the current version before you make a decision based on it. This page explains how to read that data correctly, since the raw numbers are easy to misread without context.

Friendly editorial photography gives long research pages a natural visual pause while the detailed data, sources, tables, and guidance stay central.
Education photo via UnsplashHow to read a median wage figure correctly
The "median annual wage" BLS reports for an occupation is the midpoint: half of workers in that occupation earn more, half earn less. It is not the average starting salary, and it blends geography, experience level, employer type, and industry together into one national number. A civil engineer's median wage nationally was $99,590 in May 2024, for example, but a first-year civil engineer in a rural area earns meaningfully less than that, while an engineer with fifteen years of experience in a major metro area often earns meaningfully more. Treat the median as a long-run reference point for the occupation as a whole, not a prediction of your first paycheck.
BLS also reports wage percentiles (10th, 25th, 75th, 90th) for most occupations, which paint a fuller picture than the median alone — the gap between the 10th and 90th percentile tells you how much a given field's pay varies by experience, location, employer, and specialization, information that is often more useful than the median in isolation.
How to read job outlook and growth projections
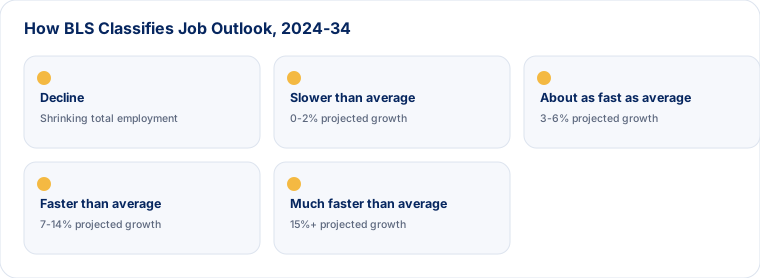
BLS employment projections estimate how much an occupation's total employment will grow (or shrink) over a ten-year window, currently 2024-2034, expressed as a percentage compared to the projected average growth rate for all occupations (about 4% over that period). "Much faster than average" growth (typically 8%+) signals strong long-term demand; "decline" signals a shrinking occupation, which does not necessarily mean zero opportunity, but does mean more competition for a smaller number of openings. Growth percentage alone can also mislead: a small occupation growing 30% adds far fewer total jobs than a large occupation growing 5%. BLS also reports projected annual openings, which combines growth with the more common driver of hiring — workers leaving the occupation through retirement or career change — and is often the more useful number for understanding real-world opportunity.
Why your city or state changes the numbers
National median wages hide enormous regional variation. The same occupation can pay very differently in a high-cost metro area than in a small town, and cost of living moves in the same direction more often than not, which means a lower nominal salary in a lower-cost area does not automatically mean lower purchasing power. BLS publishes state- and metro-area-level wage data (the Occupational Employment and Wage Statistics, or OEWS, program) in addition to the national figures summarized on this site, and checking your specific state or metro area before making a decision is worth the extra step, particularly for fields with large regional pay gaps such as software development, law, and healthcare.
How BLS groups occupations, and why that matters here
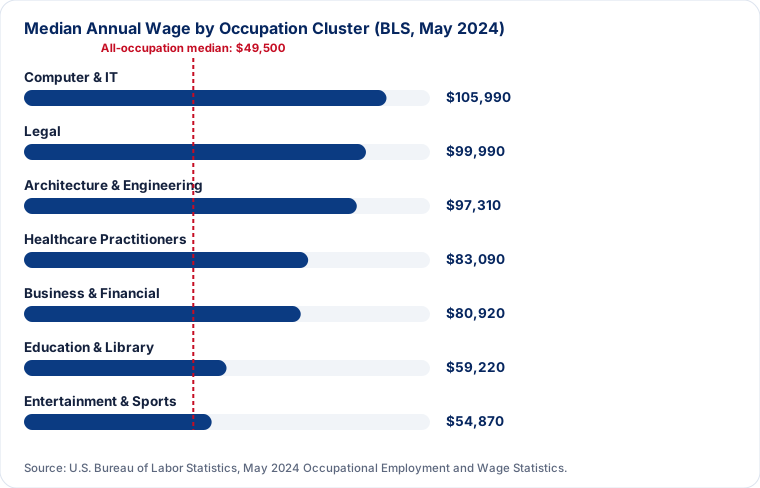
BLS organizes detailed occupations into broader clusters — business and financial operations, healthcare practitioners and technical, computer and mathematical, architecture and engineering, education and library, legal, life/physical/social science, and arts/design/entertainment/media, among others — and each cluster has its own overall median wage and growth pattern. As grounding reference points gathered directly from BLS: business and financial occupations had a May 2024 median wage of $80,920; healthcare practitioner and technical occupations, $83,090 (with registered nurses specifically at $93,600); computer and information technology occupations, $105,990; architecture and engineering occupations, $97,310; legal occupations, $99,990 (lawyers specifically at $151,160); educational instruction and library occupations, $59,220; and entertainment and sports occupations, $54,870 — all compared against the $49,500 median for all occupations nationally. These cluster-level figures are useful context when comparing fields you are less familiar with, since a specific occupation's wage usually sits somewhat above or below its cluster's overall median depending on required education and experience level.
Remote work, hybrid roles, and how that shifts the picture
Since the pandemic-era shift toward remote and hybrid work, a meaningful share of jobs in fields such as software development, data analysis, accounting, marketing, and customer-facing business roles can be performed partly or fully outside a traditional office, which changes how regional wage data should be used. A worker in a lower-cost state performing a fully remote role for an employer headquartered in a high-cost metro area may be paid closer to that metro area's wage scale, or may be paid on a geography-adjusted scale — policies vary by employer and are worth asking about directly during a job search rather than assuming either way. Fields that require physical presence — healthcare delivery, skilled trades, hospitality, most engineering lab and field work — are less affected by this shift, and their regional wage data remains a more direct predictor of what you'll actually earn locally.
Why entry-level pay looks different from the median
Because the median wage blends all experience levels, entry-level pay in most fields sits below it, sometimes well below it for fields with a steep experience curve (law, medicine, and finance are common examples, where early-career pay can be a fraction of the mid-career median). Look for entry-level-specific salary data when it is available, ask about starting salary ranges directly during informational interviews or career fairs, and treat the national median as a longer-term benchmark for the third, fifth, or tenth year in a field rather than the first.
When a degree alone is not enough
For a meaningful share of the fields covered on this site — nursing, teaching, accounting (for CPA status), law, medicine, pharmacy, dentistry, social work (for clinical licensure), and several engineering roles — a degree is a necessary but not sufficient condition for practicing in the field. Licensure exams, supervised experience hours, background checks, and continuing education requirements sit between graduation and independent practice, and they add real time and cost that a program's advertised graduation timeline does not always make obvious. Each program page on this site notes the licensure or certification pathway typically associated with that field; confirm current requirements with your state's licensing board before assuming a specific program satisfies them, since requirements are set at the state level and vary.
Internships, clinicals, and other required experience
Beyond formal licensure, many fields functionally require hands-on experience before a graduate is competitive for entry-level roles, even when it is not legally mandated. Business, marketing, and communications employers frequently expect at least one relevant internship; nursing and allied health programs build supervised clinical hours directly into the curriculum; social work requires a field practicum as part of CSWE-accredited programs; engineering employers weigh co-ops and design-project experience heavily. When comparing programs, ask specifically how each helps students secure this experience — a dedicated career services office, guaranteed clinical placements, employer partnerships — rather than assuming all programs in the same field provide equivalent access.
A simple framework for weighing cost against outcome
Rather than treating "is this degree worth it" as a single yes/no question, it helps to break it into four comparisons:
- Total cost — net price after grants and scholarships, not sticker price, multiplied by the realistic number of years to completion.
- Expected debt at graduation — compare projected total federal and private loan balance to the field's realistic entry-level salary, not the long-run median.
- Licensure and credentialing costs — exam fees, required supervised hours (sometimes unpaid or low-paid), and continuing education, which some fields require and others do not.
- Time to a paycheck — a two-year associate degree that leads to licensure quickly can outperform a four-year degree in lifetime return even with a lower ceiling, depending on the field and the individual's circumstances.
None of these numbers make the decision for you, but running them explicitly, using real BLS data and a specific college's actual net price rather than national averages, produces a far more reliable answer than comparing sticker prices or rankings alone. Our comparison framework walks through the same four factors side by side for multiple programs at once, and the financial aid guide covers how to estimate net price and realistic borrowing before you apply.
Frequently asked questions
Where does BLS get its wage data?
Primarily from the Occupational Employment and Wage Statistics (OEWS) survey, which collects data directly from a large sample of U.S. employers twice a year, rather than from self-reported school outcomes data.
How often should I check for updated figures?
BLS updates median wage data annually (typically each spring, reflecting the prior May) and employment projections roughly every two years. If you are making a multi-year decision, it's worth rechecking bls.gov before enrolling and again before graduating.
Does a "faster than average" outlook guarantee a job?
No. It describes an aggregate national trend, not a guarantee for any individual, and it does not account for how competitive a specific employer, region, or specialization within the field might be.
Why do some program pages list more than one occupation?
Most degrees lead to a range of roles, not one single job title, so we list several of the most directly related BLS occupation categories rather than implying a single fixed outcome.
Is a declining-outlook occupation always a bad choice?
Not necessarily. Declining national employment can still mean a stable career for an individual, particularly in fields with high retirement rates that create ongoing openings even as total employment shrinks slightly, or in fields where a specific specialization within the broader occupation is growing even as the overall category contracts. Use the outlook figure as one input, not a veto.
Do career services offices actually help with job placement?
They vary considerably in quality and resourcing. Ask a program directly about specifics — employer partnerships, on-campus recruiting events, alumni mentorship networks, and (where a program reports it) first-destination outcomes data — rather than accepting a general claim that "our career services team will help you." Talking to a current student or recent graduate about their actual experience is often more informative than the office's own marketing materials.
Should I pick a major based only on salary data?
Most career counselors advise against that. Sustained performance in a field usually depends on genuine interest and fit as much as on starting pay, and a mismatch between a student's interests and a purely salary-driven major choice is a common contributor to switching majors or leaving a field entirely after graduation. Use wage and outlook data to narrow a shortlist of fields you're already genuinely interested in, rather than as the sole deciding factor.
